Incorta Nexus Forecasting
Introduction to forecasting
Forecasting is a powerful feature in Incorta Nexus that allows you to predict future trends based on historical data. Using machine learning algorithms, Nexus can generate accurate forecasts and detect anomalies to help you make data-driven decisions for your business.
Starting 2025.7.1, Incorta Copilot has been renamed to Incorta Nexus.
Prerequisites
- The prophet library must be installed.
How Forecasting Works in Incorta
- Displays results as a visual time series with both historical data and projected forecasts for a target measure
- Includes confidence intervals
Forecasting command syntax
The simplest way to use forecasting in Incorta Nexus is with the basic command syntax:
/forecast [time interval] [measure]
By default, this command will generate a one-month forecast.
Examples:
/forecast weekly sales
This will aggregate data to a weekly level, prior to creating a month's worth of forecasting.
/forecast daily orders
This will aggregate data to a daily level, prior to creating a month's worth of forecasting values.
Advanced forecasting command
For more control over your forecasts, you can use the detailed syntax:
/forecast [time interval] [measure] for [how many periods to forecast]
Examples:
/forecast daily orders for 365 days
This will aggregate data to a daily level, prior to creating a year's worth of forecasting values.
Time interval options
The time interval parameter defines the granularity of your forecast. Common options include:
- daily
- weekly
- monthly
- yearly
Forecast length
You can specify how far into the future you want to forecast by adding "for [time period]" to your command. Examples:
- for 30 days
- for 12 weeks
- for 6 months
- for 2 years
Interpreting the Forecast results

When viewing your forecast in Incorta:
- The solid blue line represents your historical data
- The dashed red line shows the predicted values
- The pink shaded area indicates the confidence interval (the range within which the actual values are expected to fall)
- The x-axis shows the time periods
- The y-axis displays the measure values
Anomaly Detection
Nexus supports anomaly detection in time-series forecasting to identify unexpected deviations or patterns in historical or real-time data. This enables early visibility into issues such as fraud, inventory discrepancies, equipment malfunctions, or abnormal system behavior that may require immediate attention.
Example
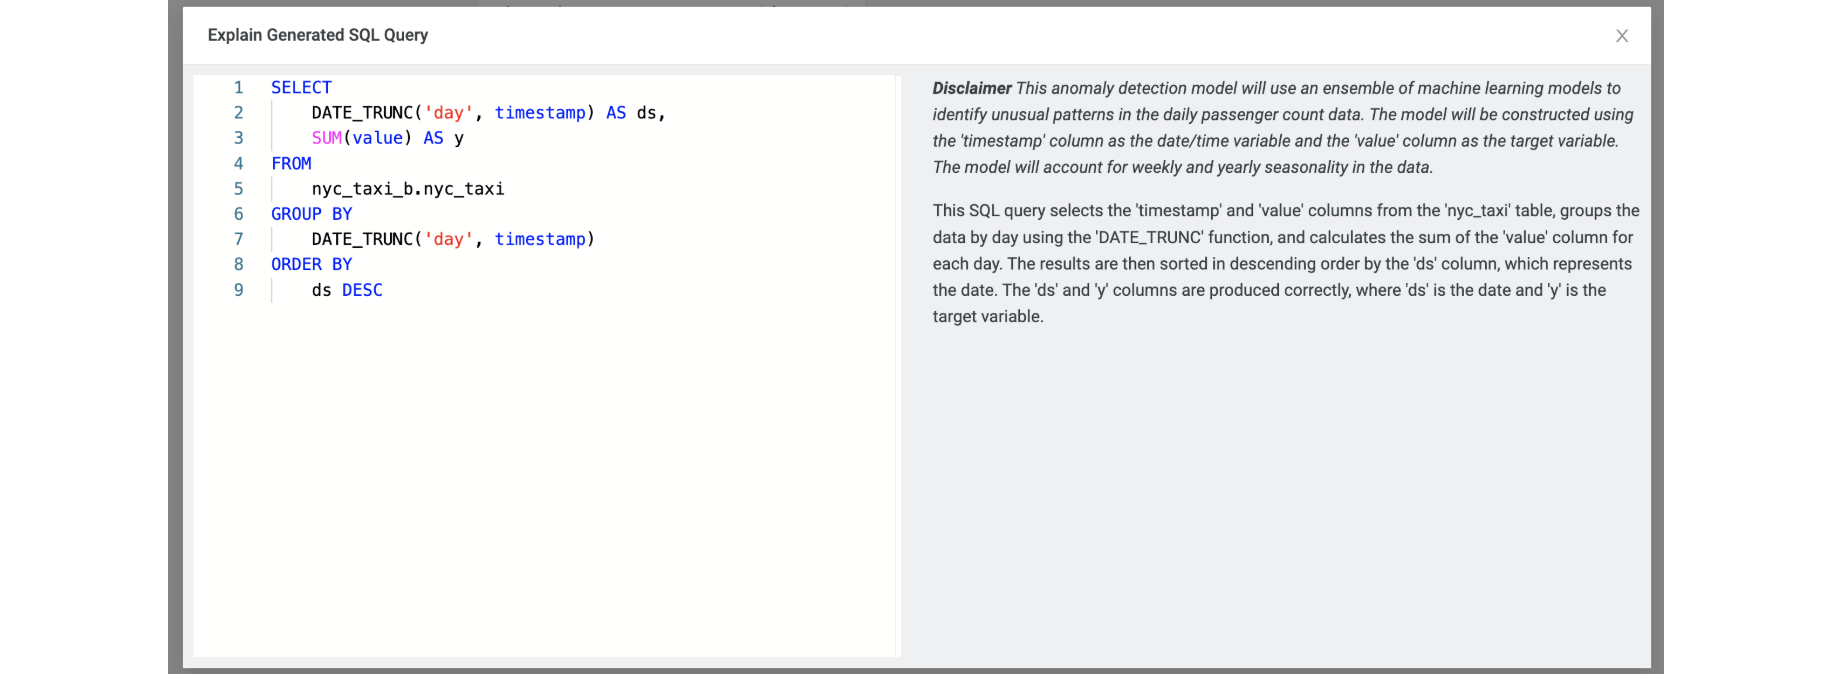
The following example demonstrates how to use Nexus to detect anomalies in the daily passenger counts of New York City taxis, highlighting unusual spikes or drops in ridership over time with tooltips displayed when hovering over these points.
Run the anomaly detection command:
/detect-anomalies daily passenger count

You can view the generated SQL query and its description by selecting Query Breakdown.
Additional features
- Query Breakdown: Select the "Query Breakdown" button (visible in the top right of all three example panels) to see the SQL and logic used to generate the forecast.
- Toggle View: Switch between table and chart views using the buttons in the upper right of each visualization panel (shown as grid and line chart icons).
- Highlighted Forecast: Use the "Highlighted Forecast" toggle (visible in all three examples) to emphasize the forecast portion of the chart.
Tips for better forecasting
- Use sufficient historical data: More historical data generally leads to more accurate forecasts, as seen in the visualizations example, where rich historical data provides the foundation for predictions.
- Consider seasonality: Make sure your historical data captures any seasonal patterns relevant to your forecast. The weekly sales example specifically mentions "seasonal pattern with a weekly period" that informs inventory decisions.
- Check the confidence interval: Wider confidence intervals suggest higher uncertainty in the forecast. Notice how the pink shaded areas in all three examples vary in width, indicating different levels of prediction confidence.
- Compare different time intervals: Sometimes forecasting at different granularities (weekly vs. daily) can reveal different insights, as demonstrated by the different patterns visible in the weekly sales vs. daily orders forecasts.
- Update forecasts regularly: As new data becomes available, regenerate your forecasts for improved accuracy. The summaries for all examples note that the forecasts are "reasonably accurate" given current data.
- Look for anomalies: Observe data for anomalous events and filter out. Understanding such anomalies can help create more accurate forecasts.
Business applications
Based on the example forecasts shown:
Inventory Management: Both the weekly sales and long-term forecasts specifically mention recommendations for inventory adjustments based on predicted demand.
Demand Planning: The forecasts provide expected values that can help with staffing and resource allocation.
Trend Identification: All three examples identify underlying trends (rising, steady increase, continued growth) that inform business strategy.
Supply Chain Optimization: The weekly forecast specifically mentions "adjustments to inventory and supply chain management" based on predicted values.
Seasonal Planning: The forecasts identify seasonal patterns that help businesses prepare for cyclical changes in demand.