Data Applications → Analyze Finance
Finance dashboard folder
The finance dashboard folder is a component that represents the finance functional area in Incorta Cloud. It includes two prebuilt dashboards:
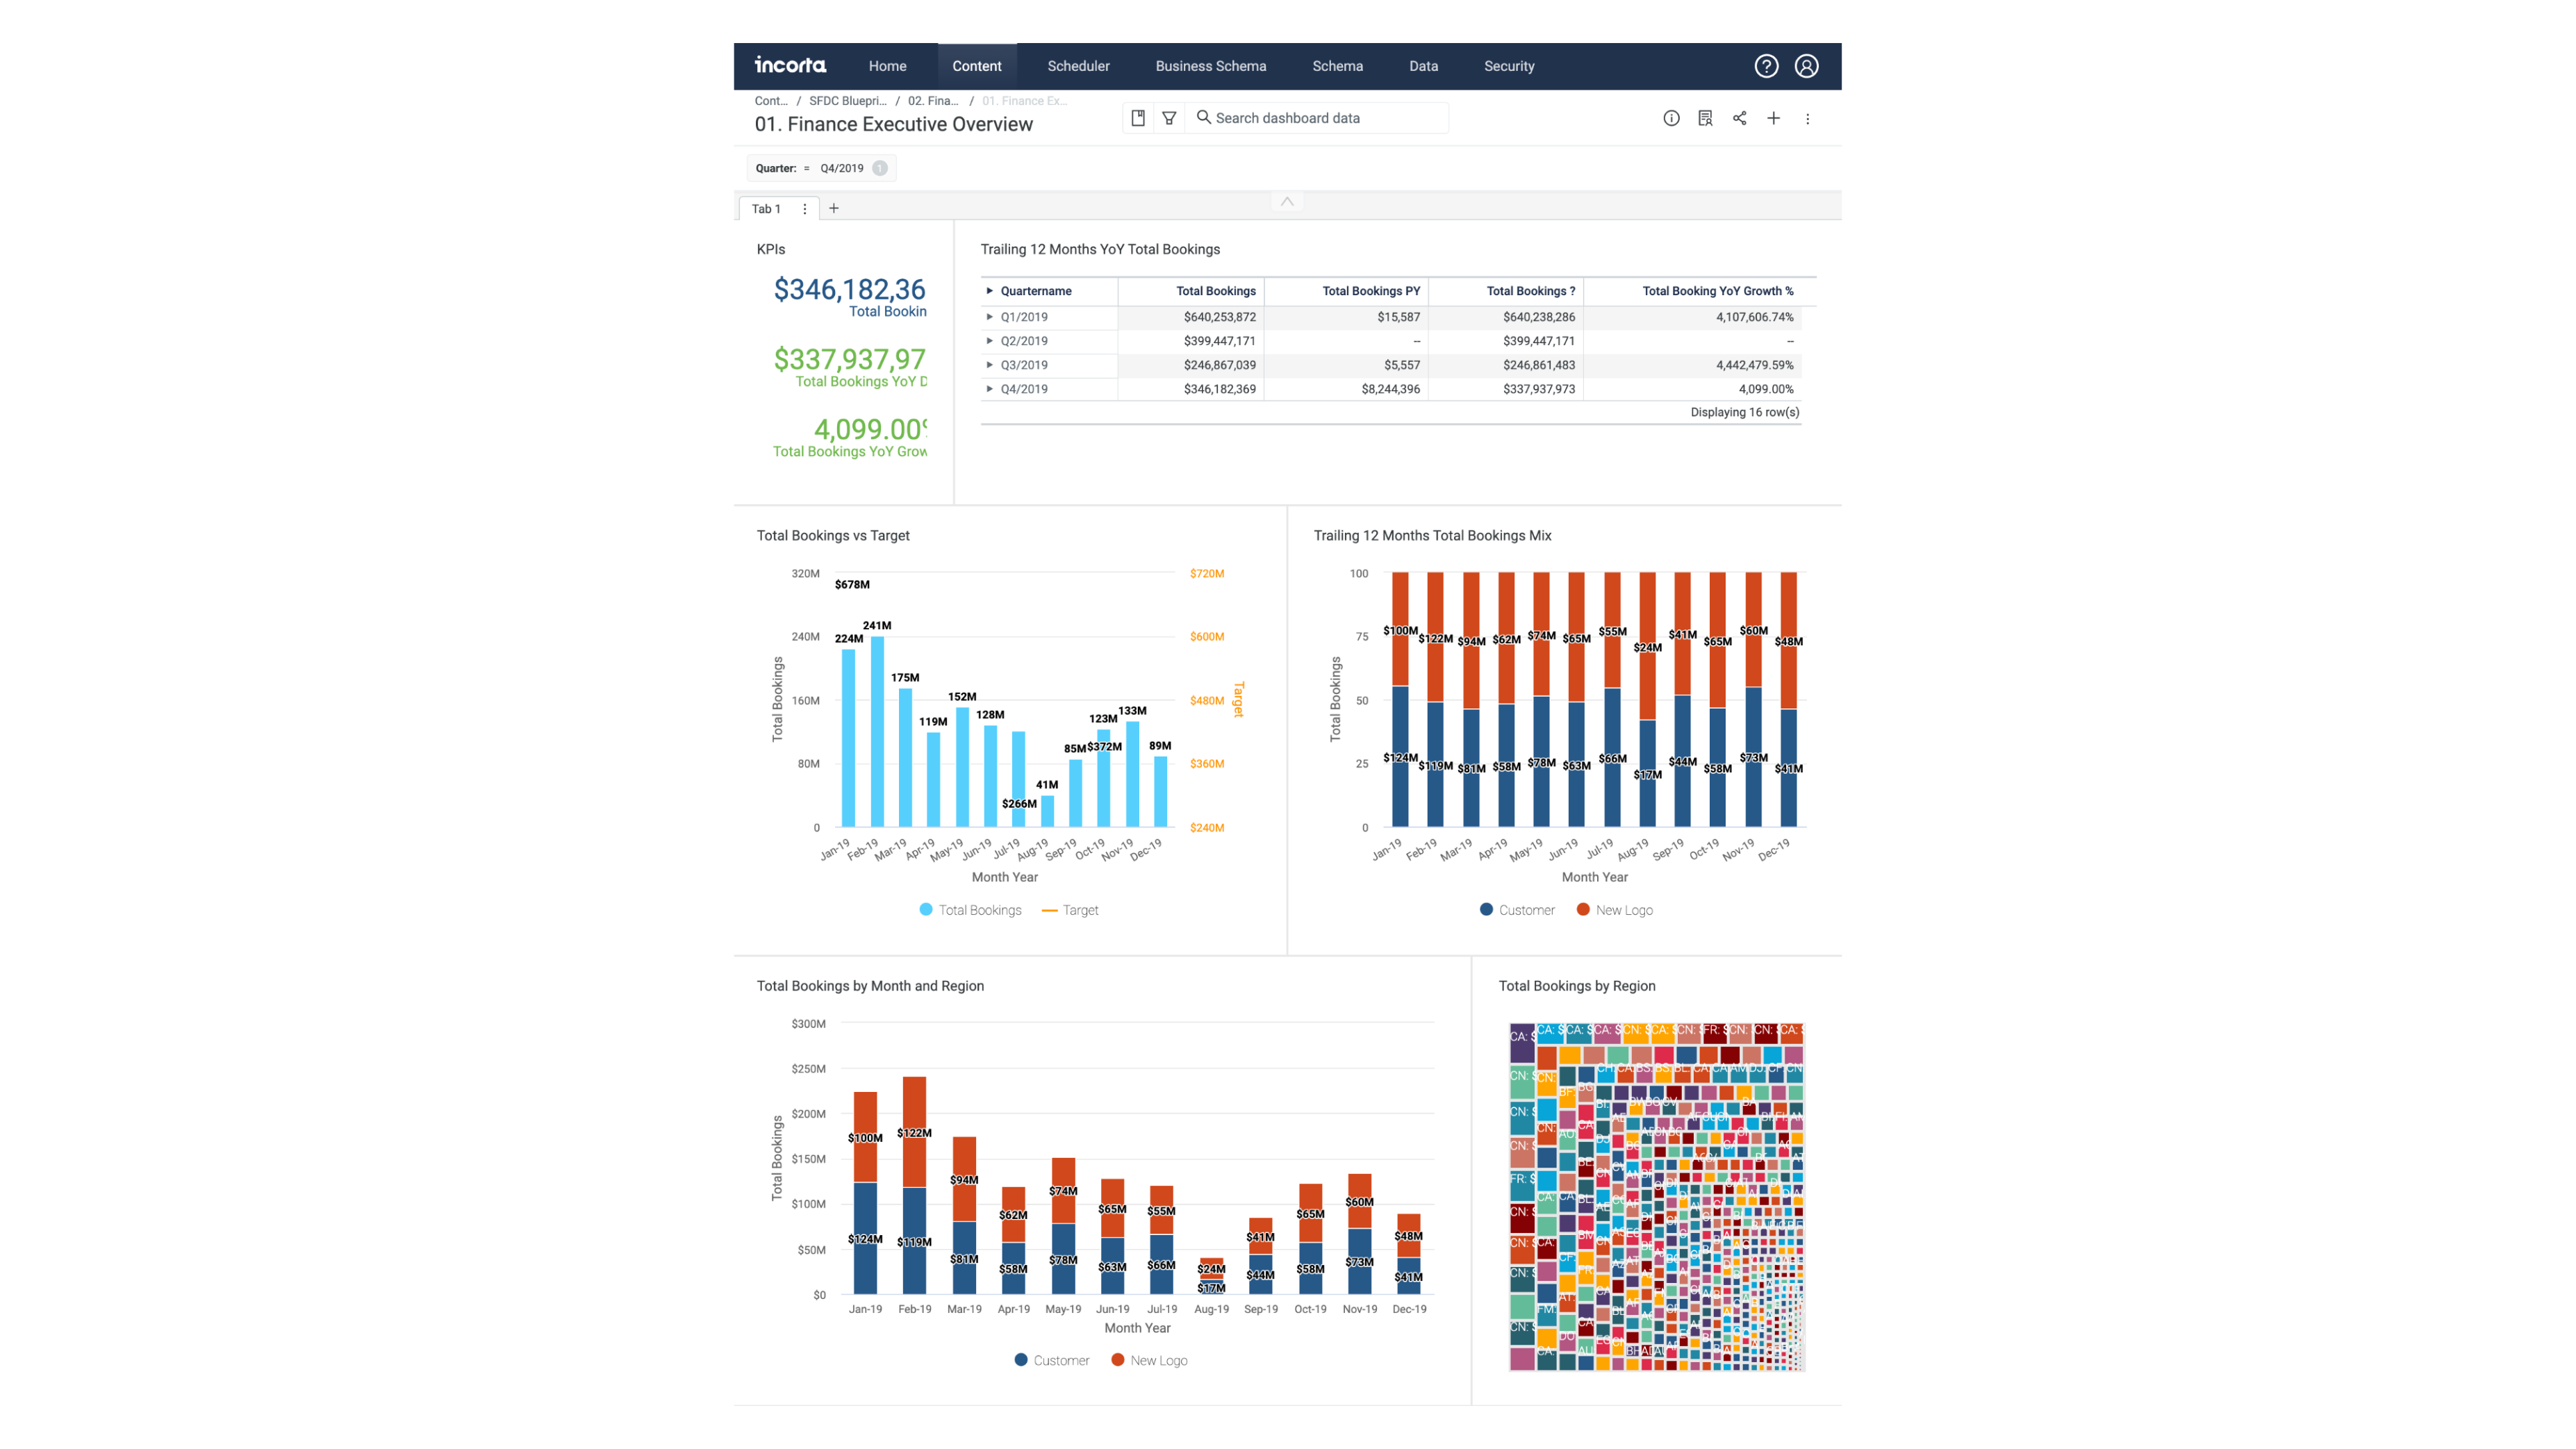
Finance Executive Overview
The following table shows the finance executive overview insights.
| Insight | Description |
|---|---|
| KPIs | This KPI insight shows the total number of bookings , YoY Diff, and YoY Growth in the quarter you select |
| Trailing 12 Months YoY Total Bookings | This aggregated table insight shows heading details for the trailing 12 months year-over-year total bookings |
| Total Bookings vs Target | This combo dual axis insight shows the total bookings versus the target for a specific month of the year |
| Trailing 12 Months Total Bookings Mix | This percent column insight shows the total bookings per opportunity type (customer, new logo) in a specific month of the year |
| Total Bookings by Month and Region | This stacked column insight shows the total bookings per region in a specific month of the year |
| Total Bookings by Region | This treemap insight shows the total bookings value per region |
FP&A Report
| Insight | Description |
|---|---|
| Actuals | This pivot table insight shows the total number of bookings per opportunity type in the quarter you select |
| Forecast | This pivot table insight shows the total forecast per opportunity type in the quarter you select |
| PY Actuals | This pivot table insight shows the total bookings value per opportunity type |
| Actuals vs Forecast | This pivot table insight shows the total bookings versus the forecast per opportunity type in the quarter you select |
| Actuals vs Forecast % | This pivot table insight shows the total bookings versus the forecast percentage per opportunity type in the quarter you select |
| Actuals vs PY Actuals | This pivot table insight shows the total bookings value versus prior year actuals per opportunity type in the quarter you select |
| Actuals vs PY Actuals % | This pivot table insight shows the percentage of the total bookings versus prior year actuals per opportunity type in the quarter you select |
| Actuals by Region | This pivot table insight shows the value of the total bookings in each region per opportunity type in the quarter you select |
